Understanding Latency 3.0, a conference focused on network latency, has started its second day. There’s still time to join the rest of day two and day three.
https://understandinglatency.com
I’ve posted a few bits related to the conference.
Understanding Latency 3.0, a conference focused on network latency, has started its second day. There’s still time to join the rest of day two and day three.
https://understandinglatency.com
I’ve posted a few bits related to the conference.
A talk describing Google’s new TCP congestion control algorithm, BBR, is now online.
Such a beautiful and simple solution to a long standing problem. This one of those situations when you have to wonder why this wasn’t done before.
On a related note, it’s interesting how BBR separates the retransmission and congestion control (rate) logic. There is a section in An Engineering Approach to Networking where the author specifically calls out that it’s easier to solve both problems if they are considered separately vs. using the retransmission window size to control the rate as most TCP congestion control solutions do. This struck me as very interesting and I’m excited to see it demonstrated by sch_fq and BBR now.
If you into networking or specifically P4 you should take a look at the recent P4 workshop presentations.
Improve small job completion times by 47% by running full clones. http://highscalability.com/blog/2014/11/3/improve-small-job-completion-times-by-47-by-running-full-clo.html
There was a good article in Communications of the ACM about how to deal with large latency variations a few months ago if you are interested in reading more.
My article on Packet Queueing in the Linux Kernel appeared in the July 2013 issue of Linux Journal. Now that a month has past, Linux Journal’s great copyright policy allows me to post the content. You can find the full article at the URL below.
Some time ago I started writing a blog post to help myself better understand where packets can be queued within the Linux kernel. This relates to my long time interest in optimizing for latency and experimenting with the kernel’s QoS features. By the time I was ready to hit the publish button, the blog post was several thousand words long and I had gotten some nice feedback so I decided to submit it to Linux Journal instead. If you are a Linux Journal subscriber you can now find the article in the July 2013 issue which has a focus on Networking.
For a long time I’ve experimented with shaping my upstream traffic via Linux’s traffic management functionality (tc command) with the goal of improving my Internet connection’s performance. The latest incarnation of this configuration can be found in this script. Anecdotally this configuration greatly improves interactive performance. Use cases such as Skype calls work without a hitch with any other network tasks I want to run at the same time. In this post I provide some simple experimental results and compare against the default configuration.
The goals of the linked tc script are twofold: improve performance under load and stop any single host from monopolizing the available bandwidth. Performance under load is improved by shaping to just below the link bandwidth which stops packets from queuing in the DSL modem and thereby allows the Linux QoS features to manage the traffic. Achieving host fairness is accomplished by hashing the hosts on the network across a set of buckets. Flow fairness is accomplished via the underlying fq_codel QDisc.
Figure 1: Subset of my home network
Figure 1 shows the layout of the network. Note that when I performed these tests I didn’t disconnect all other devices so these aren’t perfect lab style results.
The fist test involves running iperf set to 200kbps and 500 byte packets. This is meant to be somewhat similar to what an interactive application such as a Skype call would produce. The second test used my pingexp utility to chart the ICMP ping results. For both, six different load scenarios were tested (the rows in the table). In both cases the base load was generated from HostA and the test load was generated on HostB.
| Description | iperf 200kbps, 500 byte packets (HostB) |
ICMP ping results [via pingexp] (HostB) |
|
| 1 | Unloaded | 0% loss / 0.229 ms jitter | 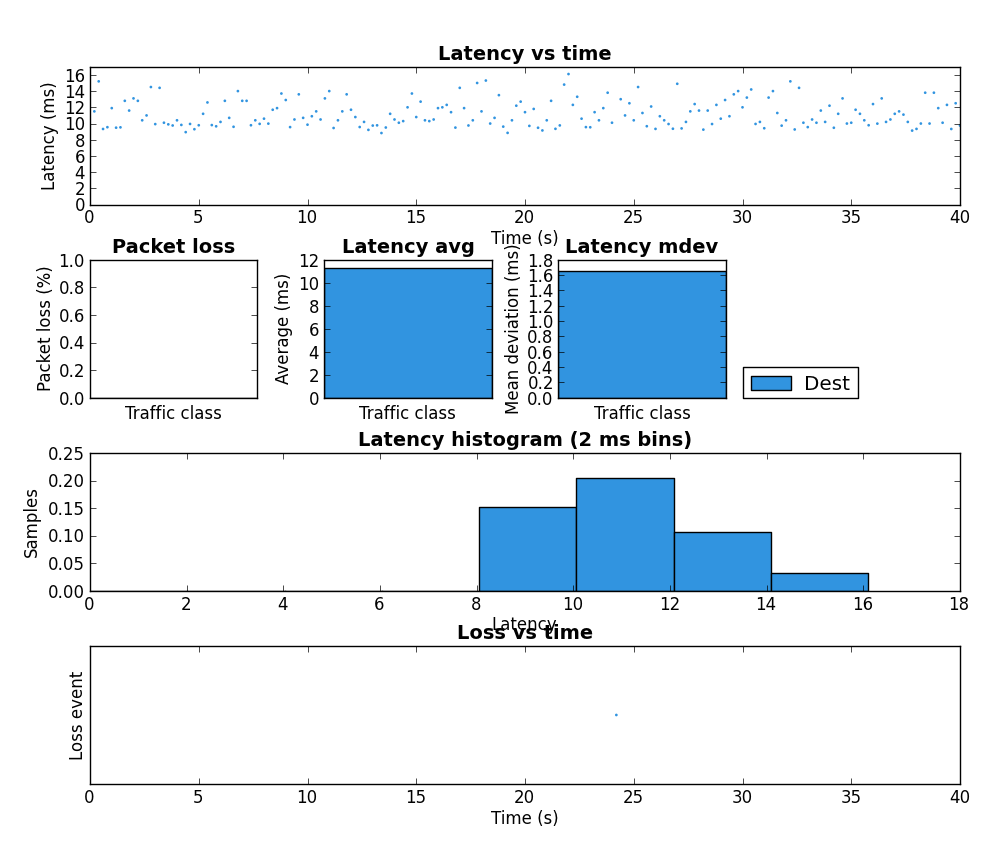 |
| 2 | Unloaded with tc script | 0% loss / 0.197 ms jitter | 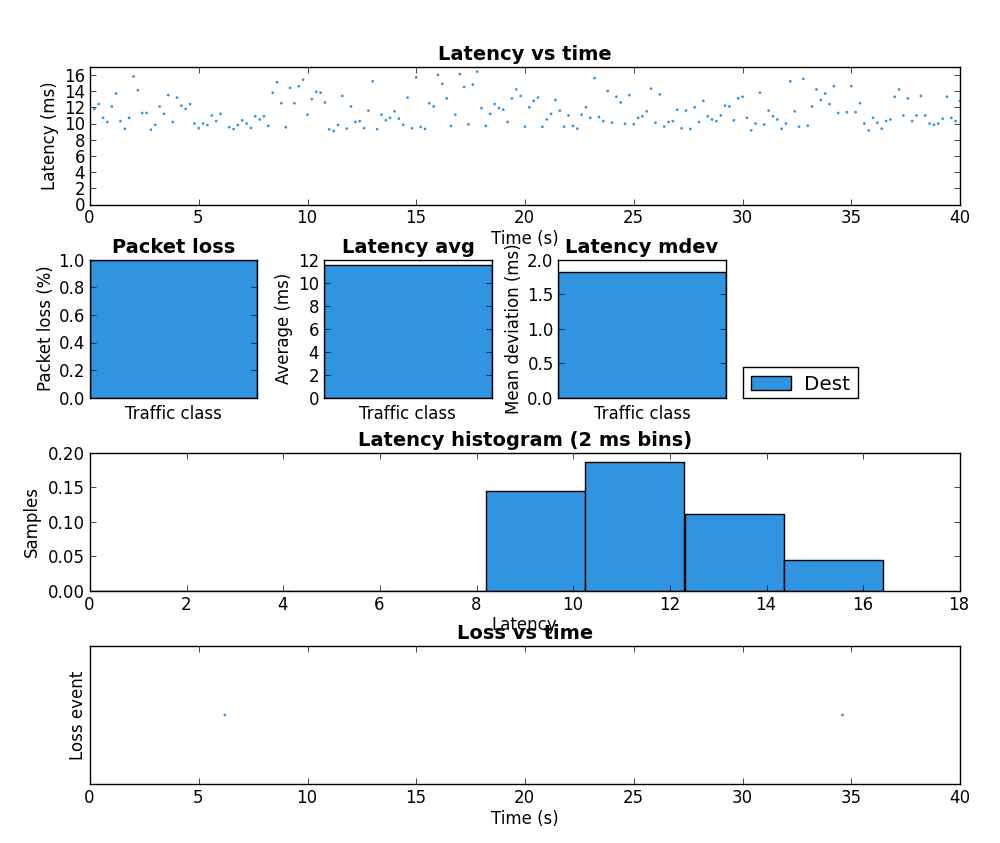 |
| 3 | Three scp from HostA |
0.6% loss / 2.6 ms jitter | 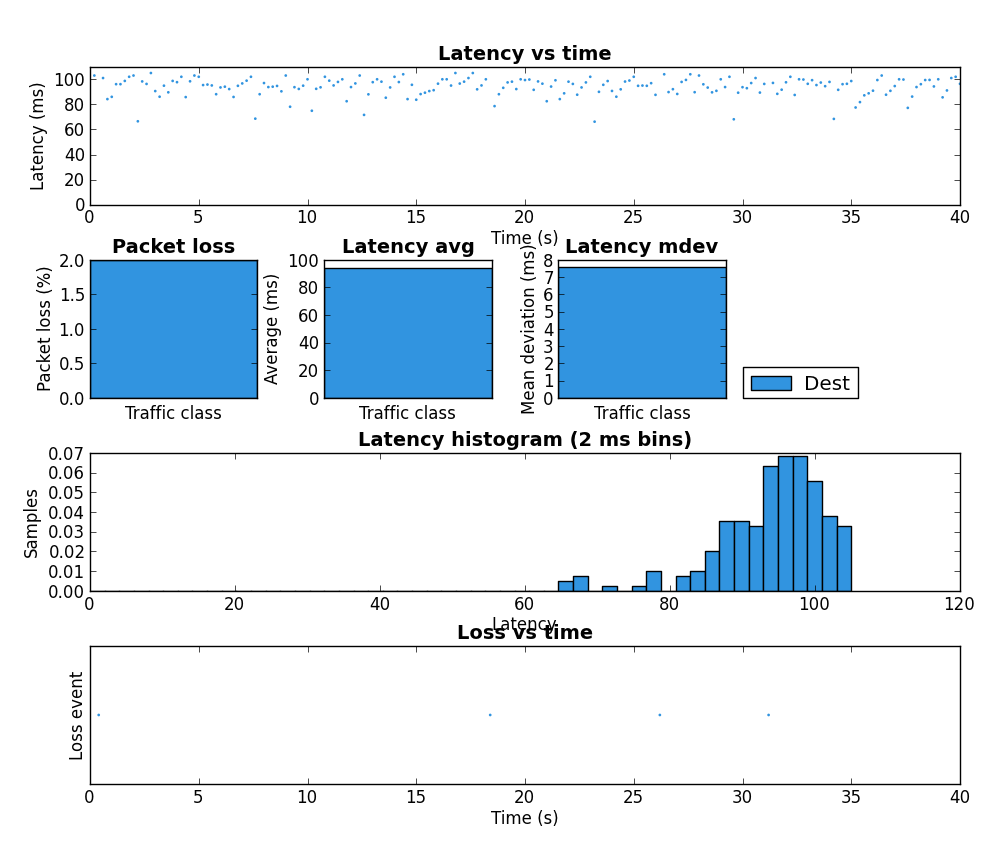 |
| 4 | Three scp from HostA with tc script | 0% loss / 0.496 ms jitter |  |
| 5 | iperf 8Mbps, 1400 byte packets from HostA |
[Attempted twice, failed on first attempt] 69% loss / 1.58 ms jitter |  |
| 6 | iperf 8Mbps, 1400 byte packets from HostA with tc script | 0% loss / 0.804 ms jitter |  |
Notice the large decrease in latency between rows 3 and 4. This is the result of shaping to below the link rate which stops the buffer in the DSL modem from filling.
The biggest improvement can be seen the last two rows of the table. Without the tc script there is a large amount of packet loss but with the tc script in place HostB’s traffic is affected very little by HostA’s. Due to the use of fq_codel as the underlying QDisc, it is very likely these results would be very similar if both iperf instances were run on HostA but this was not tested.
The third experiment duplicated the six load scenarios above but instead used a single scp transfer on HostB as the test load. Figure 1 shows the result as captured and charted by Wireshark. Each of the six scenarios were run for approximately 20 seconds.
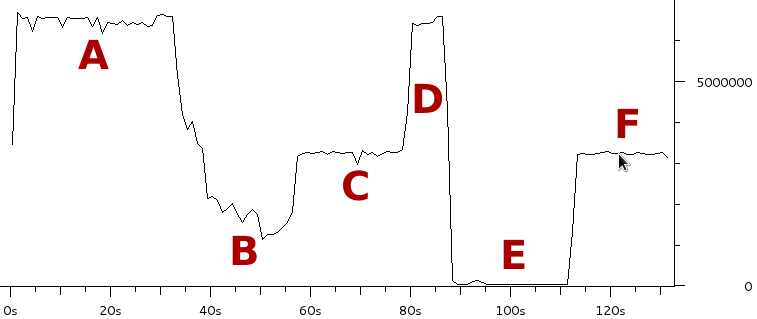
Figure 1: Bitrate of scp from HostB during the six test scenarios
The region marked A corresponds to the two unloaded scenarios (rows 1 and 2 in the table above). As expected there is little difference as both scenarios max the upstream link when there is no contention.
Notice how much the rate drops in region B (row 3 in table) when the three scps are started on HostA. The bitrate is approximately 1/4 of the link rate which is expected since there are four scps running.
Region C (row 4 in the table) has the same four scps but with the tc script in place HostB gets 50% of the link rate and therefore HostA’s three scps share the other 50%. This shows that the tc configuration achieves per host fairness in terms of bandwidth allocation.
Region D should be ignored as it is the result of me taking too long to setup scenario 5.
Region E (row 5) is very interesting. This is where the 8Mbps iperf UDP flood starts. Notice that the scp from HostB is completely drowned out and is effectively unable to transfer any data. This is an extreme example of the kind of dramatic performance drop under load which many have come to expect from busy Internet links. As we’ll see in region F, this is not a fundamental problem with the Internet, it is the result not properly managing the buffers.
Region F (row 6) consists of the same traffic as region E expect the tc script is now in place. Like region C, HostB is now getting 50% of the available bandwidth even though HostA is trying to transmit at a rate higher than the total link rate. This shows that a bit of active queue management can make an Internet connection usable under high load.
To get a sense for what difference the tc configuration makes to web performance I ran Google Chrome in benchmarking mode for the same six scenarios. The results are presented in the table below.
| url | iterations | via spdy | doc load mean | paint mean | total load mean | stddev | Read KBps | Write KBps | # DOM | |
| 1 | http://www.google.ca | 25 | false | 186.7 | 199.7 | 490 | 188 | NaN | NaN | 270 |
| 2 | http://www.google.ca | 25 | false | 176.2 | 190 | 380.7 | 181.4 | NaN | NaN | 270 |
| 3 | http://www.google.ca | 25 | false | 834.6 | 843.6 | 1506.8 | 1044.6 | NaN | NaN | 270 |
| 4 | http://www.google.ca | 25 | false | 178.2 | 192.4 | 416.7 | 226.1 | NaN | NaN | 270 |
| 5 | http://www.google.ca | Failed | Failed | Failed | Failed | Failed | Failed | Failed | Failed | Failed |
| 6 | http://www.google.ca | 25 | false | 175.4 | 188.3 | 380.5 | 176.4 | NaN | NaN | 270 |
I have marked the entries in row 5 as failed because after 120 seconds a single page load had not yet completed.
Like above, the interesting rows to contrast are three and four as well as five and six. In both cases the tc configuration greatly reduced the time required to load www.google.ca.
This post presented results which showed that the performance and predictability of a DSL residential Internet connection can be greatly improved with some basic traffic management running on a Linux router. If you don’t have a Linux router you may still want to take a look at the configuration of your home router. If it supports bandwidth shaping, try setting it to just below your link rate. The results won’t be as good as presented here but it should make a noticeable improvement.
Previous instalments:
For tonight’s edition I have increased the number of small packet sizes in the experiment and dropped the larger sizes. For each of the following data sizes (iperf -l) there are five seconds of traffic: 0, 10, 20, 30, 40, 50, 60, 70, 80, 90, 100, 110, 120, 130, 140, 150, 160, 170, 180, 190, 200, 210, 220, 230, 240, 250, 260, 270, 280, 290 and 300 bytes.

Packets per second observed at the destination
For data sizes of up to 90 bytes the packet per second value is pretty much constant. Alex Burr offered a theory on the Bufferbloat list that I may be hitting a packet rate limitation. If I understand properly, the above chart seems to support this.

Bitrate observed at the destination
From the bitrate perspective, the curve flattens around 90 bytes of data as well.
A few days ago I wrote about some interesting latency results I observed on my home Internet connection with small packets. This post adds a bit more data.
In this experiment I disabled all upstream traffic shaping and then used iperf to blast UDP packets of various sizes to a destination host I control. The transmitted rate was 10Mbps and the upstream link rate is ~6.5Mbps. On the destination I captured the packets with tcpdump and generated the charts below with Wireshark.
The charts show ten sub-experiments – 10 seconds of traffic for each data size (iperf -l): 25, 50, 75, 100, 200, 300, 400, 500, 1000, 1400 bytes. T0 is when the first packet is received.

Packets per second observed at the destination
The first chart shows the packets per second received at the destination. Not surprisingly, the packet rate is much higher with small packets.

Bitrate observed at the destination
The second chart shows the bitrate observed at the destination. Notice that for small packets the effective bitrate is much lower. This seems to support the theory that this link has a lot of per-packet overhead.